Into the Unknown: President Trump’s Liberation Day Tariffs

Authors & Contributors

The administration raised the average tariff rate to the highest level in more than 100 years before postponing their implementation for 90 days. The goal is to raise revenue and restore the US trade balance. Whether it works remains to be seen.
The Liberation Day announcement from the White House on April 2 showed that the resolution of uncertainty may be more challenging than living with uncertainty.
A 10% duty was levied on all economies. On top of that, reciprocal tariffs were placed on 90 countries, which globally cover 65% of GDP and almost 80% of the population with 6.25 billion people.1 Those reciprocal tariffs range from 10% to 49%, bringing the total tariff duties for those affected from 20% to 59%.2 Those rates are proportional to bilateral trade imbalances with the US, falling most heavily on Asian Pacific economies.
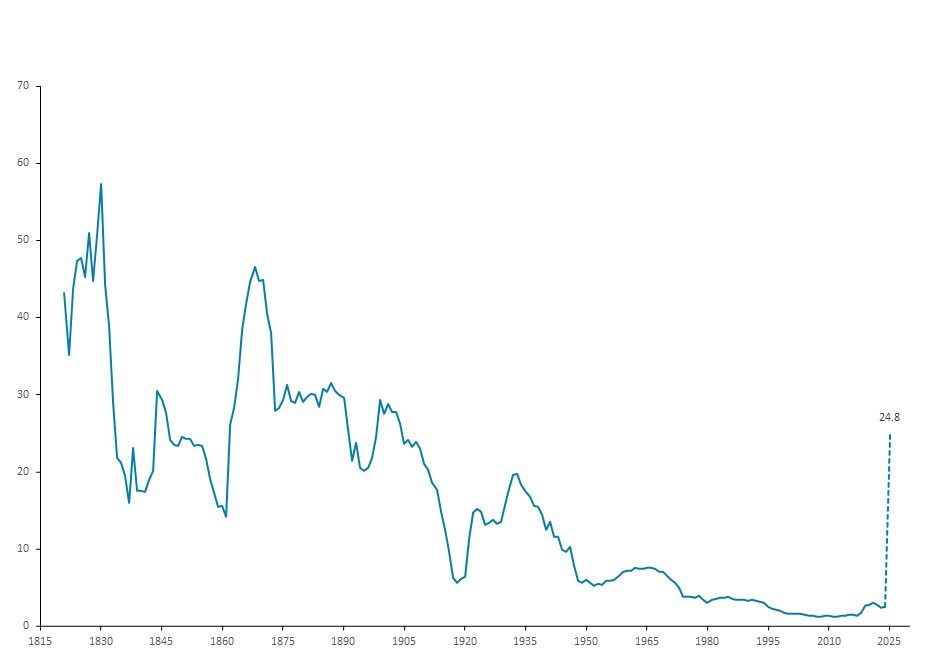
Taking account of exemptions on energy, pharmaceuticals, commodities not produced in the US and some intermediate goods under the US Mexico Canada Agreement (USMCA), and other levies (autos, steel and aluminum, among others), we estimate that the average tariff rate rises to 24.8%, the highest since 1904.3
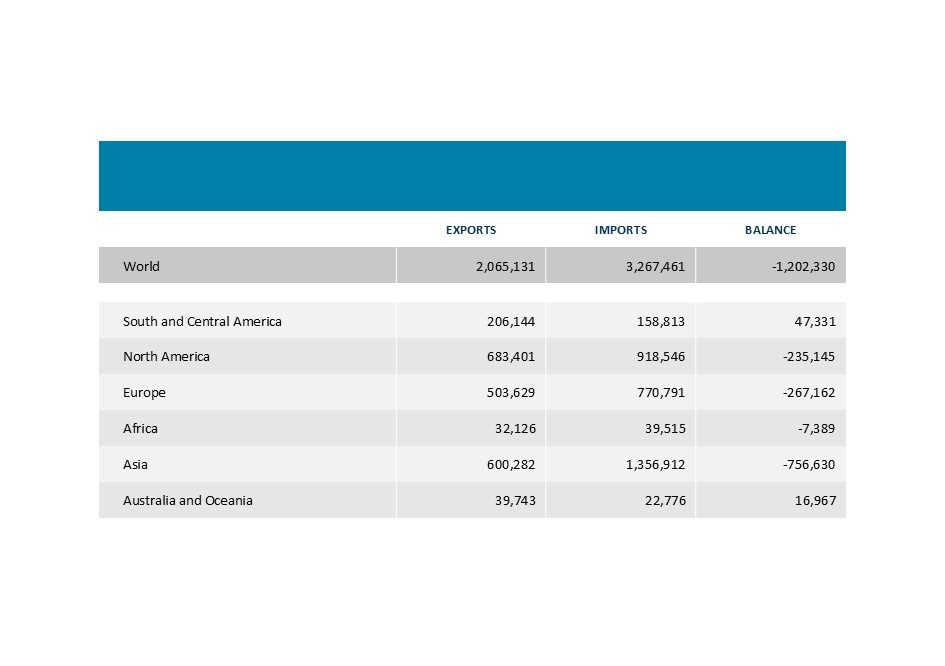
US trade in goods, 2024
millions of US dollars
Will This Help Raise Revenue?
Raising revenue from tariff duties was an explicit part of President Trump’s message. The calculation of reciprocal tariffs from the Office of the Trade Representative assumed that nominal trade activity will remain unchanged after the tariffs, with import prices increasing by one-quarter of the duty hike and volumes declining by one-quarter from the price increase.4 If so, given the composition of trade in 2024 and the same assumptions above concerning incidence, duties would rise about $800 billion, or 2.75% percent of nominal GDP.5
All else equal, passing that directly to the Treasury’s coffers would produce the largest annual swing in revenue to nominal GDP since 1943.2 However, enough is held equal to make this calculation highly unlikely. A price elasticity of trade one-quarter higher (and still within empirical confidence bands) cuts the GDP share by over one-half percentage point. Moreover, nominal activity will likely suffer, reducing imports by more (from such a withdrawal of household income and retaliation by our trading partners), which is all but certain.2
Average tariff rate on all imports
percent
Will This Improve the Trade Balance?
Trade balance is ultimately about saving and investment. Economic theory suggests that relative prices, including the exchange rate, adjust to redirect trade and produce the same balance at a lower level of trade.
In principle, if the Trump administration applied the duty income from tariffs to work down the deficit, the saving-to-investment imbalance would somewhat correct. The calculation of revenue, however, is uncertain, and its use will be entangled with budget negotiations and other imperatives. The administration may be counting on another mechanism to counter the prediction of theory. To the extent that trade policy puts economic activity at risk, placing Federal Reserve (Fed) easing firmly into the frame, and the administration’s apparent hostility to trading partners lessens the attractiveness of dollar-denominated assets, weakness in the dollar on foreign exchange markets could narrow the trade imbalance.
Economic Forecasts and a Possible Fed Response
Current economic forecasts combine two distinct outcomes. In one, momentum carries demand forward and policy is supportive, or at least not damaging, as longer-run benefits are capitalized into current wealth, irrespective of the achievement of the Fed’s inflation goal in the short run. In the other, the uneven application of policy and concern about transition costs seriously weakens spending, tipping the economy into recession while potentially elevating inflation.2
Tactically, the Federal Open Market Committee’s (FOMC) metaphorical playbook provides the advice that the imposition of tariffs should be treated as an adverse supply shock. However, the playbook was written for small shocks around the central tendency, not a once-in-a-century policy intervention on trade. Policy makers will reasonably fear outsized reactions in both prices and aggregate demand, the former threatening to un-anchor inflation expectations and the latter possibly veering into recession territory. In the past three business cycles, recession fears dominated, and the Fed moved quickly and aggressively around the downturn. This time, however, officials may be concerned that preemptive policy might appear politically motivated, a sense not helped by the White House’s advice on monetary policy.
The April 2 Liberation Day announcement was unprecedented, and the effect on revenue, trade balance and even a potential recession remains muddied by multiple variables. True impact remains to be seen in the weeks and months ahead.
1 As of 2024, tallied from the latest World Economic Outlook Database of the Internation Monetary Fund (October 2024).
2 Tax Foundation. The Economic Impact of the Trump Trade War. Accessed 4-10-25.
3 To emphasize, this is an estimate based on our reading of multiple Executive Orders that are mapped into Census trade data (FT900) at the five-digit end-use level. The orders are complicated (Annex II on exemptions to reciprocal tariffs runs 37 pages) and are sometimes ambiguous.
4Office of the United States Trade Representative. “Reciprocal Tariff Calculations.” USTR staff read the empirical trade literature as holding that the expected pass through to import prices of a tariff is 25 percent and the price elasticity of import volumes is 4, producing a unitary effect on nominal activity.
5The White House. “Tariffs as a Major Revenue Source: Implications for Distribution and Growth.” July 12, 2024.
PAST PERFORMANCE IS NOT NECESSARILY INDICATIVE OF FUTURE RESULTS.
All investments involve risk, including the possible loss of principal. Certain investments have specific or unique risks. No investment strategy or risk management technique can guarantee returns or eliminate risk in any market environment.
This material has been provided for informational purposes only and should not be construed as investment advice or a recommendation of any particular investment product, strategy, investment manager or account arrangement, and should not serve as a primary basis for investment decisions. Prospective investors should consult a legal, tax or financial professional in order to determine whether any investment product, strategy or service is appropriate for their particular circumstances. This document may not be used for the purpose of an offer or solicitation in any jurisdiction or in any circumstances in which such offer or solicitation is unlawful or not authorized. Views expressed are those of the author stated and do not reflect views of other managers or the firm overall. Views are current as of the date of this publication and subject to change. This information may contain projections or other forward-looking statements regarding future events, targets or expectations, and is only current as of the date indicated. There is no assurance that such events or expectations will be achieved, and actual results may be significantly different from that shown here. The information is based on current market conditions, which will fluctuate and may be superseded by subsequent market events or for other reasons. References to specific securities, asset classes and financial markets are for illustrative purposes only and are not intended to be, and should not be, interpreted as recommendations. Charts are provided for illustrative purposes and are not indicative of the past or future performance of any BNY product. Some information contained herein has been obtained from third party sources that are believed to be reliable, but the information has not been independently verified. No part of this material may be reproduced in any form, or referred to in any other publication, without express written permission.
Indices referred to herein are used for comparative and informational purposes only and have been selected because they are generally considered to be representative of certain markets. Comparisons to indices as benchmarks have limitations because indices have volatility and other material characteristics that may differ from the portfolio, investment or hedge to which they are compared. The providers of the indices referred to herein are not affiliated with Mellon Investments Corporation (MIC), do not endorse, sponsor, sell or promote the investment strategies or products mentioned herein and they make no representation regarding the advisability of investing in the products and strategies described herein. Investors cannot invest directly in an index.
Vincent Reinhart is the firm's Chief Economist and Macro Strategist. In this role, he is responsible for developing views on the global economy and making relative value recommendations across global bond markets, currencies and sectors.
Mellon Investments Corporation (MIC) is a registered investment adviser and subsidiary of The Bank of New York Mellon Corporation. MIC is composed of two divisions; Mellon, which specializes in index management, and Dreyfus, which specializes in cash management and short duration strategies.