Teutonic Shift: German Stimulus Reshapes the European Outlook

Authors & Contributors


Germany’s €500 billion spending package has sent shockwaves throughout Europe. How will this affect Europe’s monetary policy moving forward?
German Industrial Production

In March, the German government passed a landmark spending package, ending decades of German austerity and unleashing hundreds of billions of euros for defense and infrastructure. This move forces a reconsideration of fiscal policy for the euro area’s largest economy, which could significantly lift Germany's growth trajectory, put upward pressure on European interest rates and boost productivity.
The decision follows the recent election in February, in which the Christian Democratic Union of Germany (CDU) regained the chancellorship and formed a coalition with the Social Democratic Party of Germany (SPD). The sense of urgency was high, given an abrupt shift in US defense policy. The spending bill, which required more than a two-thirds majority vote in parliament to reform the “debt brake,” will enable virtually unlimited borrowing for defense needs and establish a €500 billion fund to modernize infrastructure.
Debt to GDP
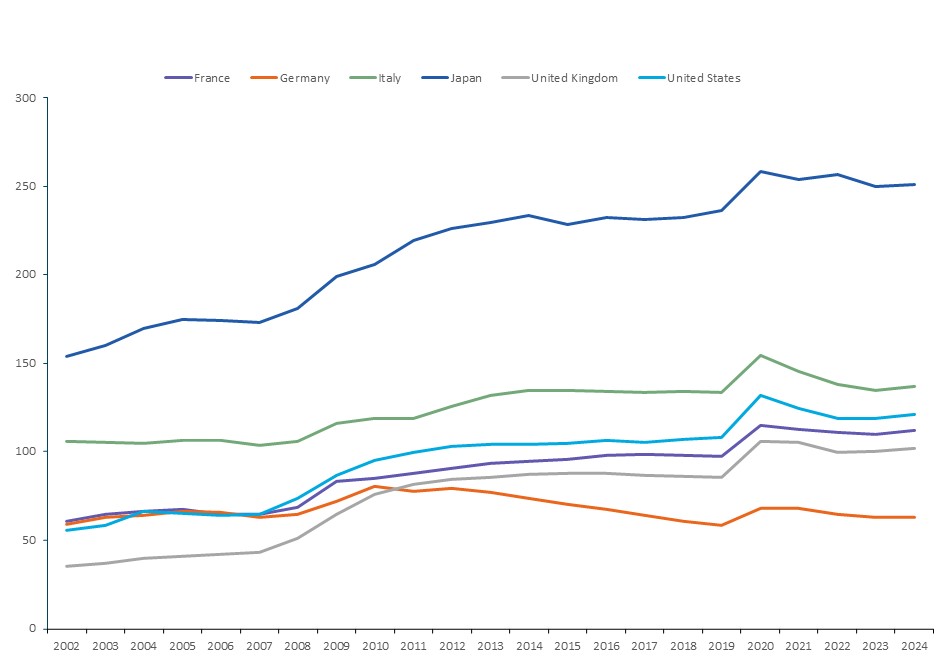
German fiscal spending could increase by approximately €1 trillion over the next decade, which may provide a significant boost to the economy and raise Germany's growth trajectory. It is likely good timing, as German real GDP has slumped for two consecutive years with its industrial sector struggling amidst higher energy costs as a consequence from the war in Ukraine.
A potential trade war with the US will likely present headwinds to Germany’s export sector, particularly automakers, who have already lost market share to low-cost competitors like China. This is reflected in German industrial production data which is about 10% lower than its pre-pandemic levels. Fiscal stimulus would likely provide a sustained lift to domestic demand and better insulate Germany’s recovery against these external risks. Public infrastructure investments often take time to implement, but they have a high growth multiplier and can improve productivity growth. Meanwhile, defense spending is likely to be focused on European manufacturers.
So, how will Germany pay for it? Higher fiscal spending will be financed by sales of bunds, with bund issuance ramping up in the coming quarters. However, the fiscal trajectory still looks healthy given Germany's strong starting point. Even after a decade of 3% extra deficits, Germany's debt-to-GDP ratio is projected to still outshine many Organization for Economic Co-operation and Development (OECD) economies, including the US.
30-Year Government Bond Yields
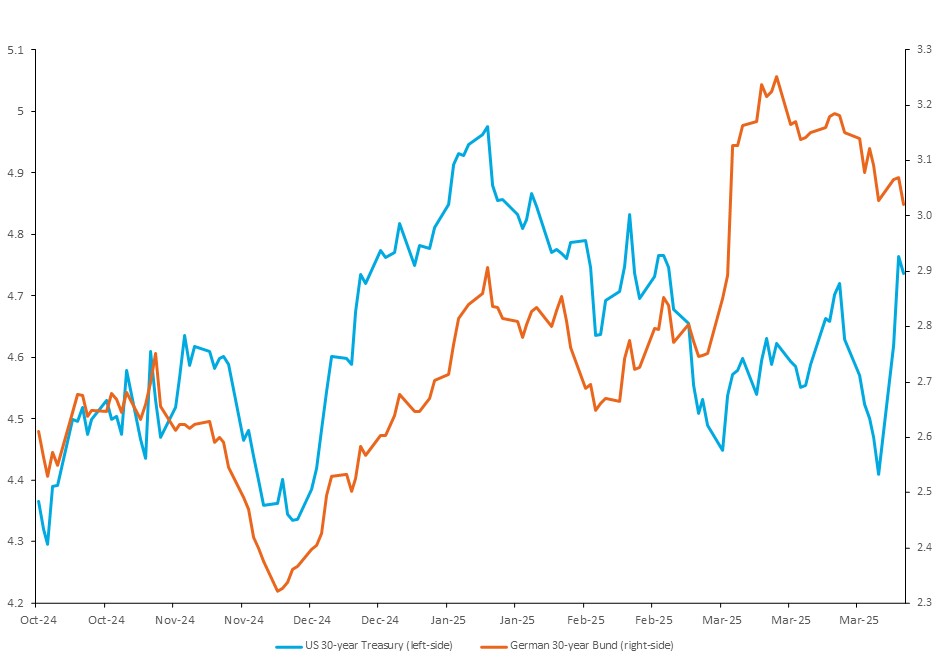
Financial markets have begun to reprice this tectonic, or some might say teutonic, shift in German fiscal policy. The yield on a 30-year German bund was trading at 2.97% on April 9, an increase of almost 40 basis points (bps) from before the February election and at their highest yields since 2011. It may also be a factor behind the German stock market’s outperformance of the US, with the German DAX up +3.5% year-to-date through April 9, versus the S&P 500® which is down almost -7%.
European defense companies lead the way. German defense supplier Rheinmetall has seen its share price more than double year-to-date. Shockwaves have spread throughout the region, with share prices for other defense manufacturers who could potentially benefit from re-armament, like Sweden’s Saab and the UK’s BAE Systems also rising significantly. We anticipate German military spending as a percentage of GDP to rise to at least 3%, exceeding the 2% NATO (ex-US) average.
Does this change the European Central Bank’s (ECB) outlook for monetary policy? In the near term, we expect the ECB will likely stick to its plan of taking the policy rate toward neutral by the end of this summer, given the sustained downtrend in inflation and cooling labor markets. By then, the elevated uncertainty facing markets, especially around trade policy and the path of US monetary policy may become clearer. That said, a stronger growth trajectory for the euro area’s largest economy could add to inflation pressures, supporting the hawk camp in the ECB that calls for fewer rate cuts.
PAST PERFORMANCE IS NOT NECESSARILY INDICATIVE OF FUTURE RESULTS.
All investments involve risk, including the possible loss of principal. Certain investments have specific or unique risks. No investment strategy or risk management technique can guarantee returns or eliminate risk in any market environment.
This material has been provided for informational purposes only and should not be construed as investment advice or a recommendation of any particular investment product, strategy, investment manager or account arrangement, and should not serve as a primary basis for investment decisions. Prospective investors should consult a legal, tax or financial professional in order to determine whether any investment product, strategy or service is appropriate for their particular circumstances. This document may not be used for the purpose of an offer or solicitation in any jurisdiction or in any circumstances in which such offer or solicitation is unlawful or not authorized. Views expressed are those of the author stated and do not reflect views of other managers or the firm overall. Views are current as of the date of this publication and subject to change. This information may contain projections or other forward-looking statements regarding future events, targets or expectations, and is only current as of the date indicated. There is no assurance that such events or expectations will be achieved, and actual results may be significantly different from that shown here. The information is based on current market conditions, which will fluctuate and may be superseded by subsequent market events or for other reasons. References to specific securities, asset classes and financial markets are for illustrative purposes only and are not intended to be, and should not be, interpreted as recommendations. Charts are provided for illustrative purposes and are not indicative of the past or future performance of any BNY product. Some information contained herein has been obtained from third party sources that are believed to be reliable, but the information has not been independently verified. No part of this material may be reproduced in any form, or referred to in any other publication, without express written permission.
Indices referred to herein are used for comparative and informational purposes only and have been selected because they are generally considered to be representative of certain markets. Comparisons to indices as benchmarks have limitations because indices have volatility and other material characteristics that may differ from the portfolio, investment or hedge to which they are compared. The providers of the indices referred to herein are not affiliated with Mellon Investments Corporation (MIC), do not endorse, sponsor, sell or promote the investment strategies or products mentioned herein and they make no representation regarding the advisability of investing in the products and strategies described herein. Investors cannot invest directly in an index.