We Told You So…

Authors & Contributors


We warned you in March. Will history repeat itself?
Early this year, we warned that the market was getting ahead of itself by expecting the Federal Reserve (Fed) to cut rates in March. We notice a similar pattern emerging this quarter. After a couple cooler inflation prints this spring, a 25-basis point (bp) September rate cut is now 100% priced in fed funds futures. In our view, a September cut is not a done deal. Recent data has been encouraging, but the Fed is not out of the woods yet, with inflation still above the pre-pandemic norms that were consistent with price stability. We think the Fed will require more time and improvement in the data before having enough confidence that inflation is on a sustainable path to 2%. From our perspective, the chances of the Fed delaying its first ease until December are higher than markets currently appreciate.
The market has been upbeat after the last two subdued inflation prints, which showed consumer price inflation slowing to a 3% annual rate in June. Chair Powell noted that “in the second quarter, actually, we did make some progress” in taming inflation. Are a few data points enough to convince the Fed that inflation is on a sustainable path lower? The balance of risks looks inflationary given trade tensions and uncertainty around policy out of Washington D.C. in the medium-term. Policymakers may be overemphasizing the significance of the latest data while underemphasizing the possibility that the recent slowdown could be noise and a form of payback from the hot readings in the first quarter.
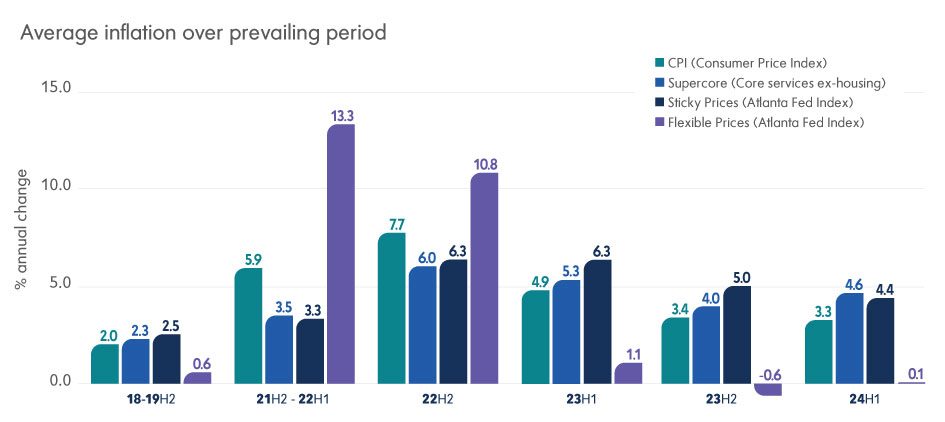
Services prices are still holding back progress on disinflation. In fact, inflation in the first half of 2024 was well above pre-pandemic norms and only a slight improvement over the second half of 2023. The labor market is cooling around the edges, but 4% average hourly earnings growth should continue to fuel service price increases. The Atlanta Fed sorts the components of the CPI into either flexible or sticky (slow to change) categories based on the frequency of their price adjustment. Sticky prices were 4.2% higher year-over-year in June, which were higher than levels associated with a swift return of overall inflation to 2%. Flexible prices, with their high energy and goods component, have cooled after turning higher in the first few months of the year. While a September ease has become the market consensus, it isn’t guaranteed.
PAST PERFORMANCE IS NOT NECESSARILY INDICATIVE OF FUTURE RESULTS.
All investments involve risk, including the possible loss of principal. Certain investments have specific or unique risks. No investment strategy or risk management technique can guarantee returns or eliminate risk in any market environment.
This material has been provided for informational purposes only and should not be construed as investment advice or a recommendation of any particular investment product, strategy, investment manager or account arrangement, and should not serve as a primary basis for investment decisions. Prospective investors should consult a legal, tax or financial professional in order to determine whether any investment product, strategy or service is appropriate for their particular circumstances. This document may not be used for the purpose of an offer or solicitation in any jurisdiction or in any circumstances in which such offer or solicitation is unlawful or not authorized. Views expressed are those of the author stated and do not reflect views of other managers or the firm overall. Views are current as of the date of this publication and subject to change. This information may contain projections or other forward-looking statements regarding future events, targets or expectations, and is only current as of the date indicated. There is no assurance that such events or expectations will be achieved, and actual results may be significantly different from that shown here. The information is based on current market conditions, which will fluctuate and may be superseded by subsequent market events or for other reasons. References to specific securities, asset classes and financial markets are for illustrative purposes only and are not intended to be, and should not be, interpreted as recommendations. Charts are provided for illustrative purposes and are not indicative of the past or future performance of any BNY product. Some information contained herein has been obtained from third party sources that are believed to be reliable, but the information has not been independently verified. No part of this material may be reproduced in any form, or referred to in any other publication, without express written permission.
Indices referred to herein are used for comparative and informational purposes only and have been selected because they are generally considered to be representative of certain markets. Comparisons to indices as benchmarks have limitations because indices have volatility and other material characteristics that may differ from the portfolio, investment or hedge to which they are compared. The providers of the indices referred to herein are not affiliated with Mellon Investments Corporation (MIC), do not endorse, sponsor, sell or promote the investment strategies or products mentioned herein and they make no representation regarding the advisability of investing in the products and strategies described herein. Investors cannot invest directly in an index.